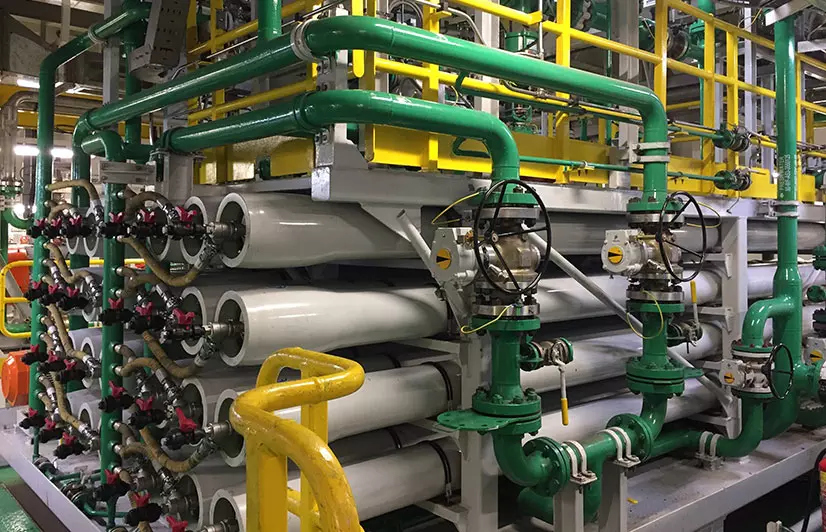
An RO system rarely fails without warning. Long before a membrane fails outright or a plant has to be shut down for emergency repairs, the operating data has usually already been signaling that something needs attention: declining flow, rising pressure, or a slow drift in water quality. The challenge is that these signs develop gradually and are easy to normalize away as "just how the system runs now." This guide walks through the specific signs that indicate an RO system needs maintenance, what typically causes each one, and how to respond before a minor issue becomes a costly one.
Declining Permeate Flow
A gradual drop in permeate flow at constant feed pressure is one of the clearest and earliest indicators of membrane fouling or scaling, since a healthy membrane produces a consistent, predictable flow for a given pressure and temperature. The key word is gradual: permeate flow naturally varies somewhat with feed water temperature, so any assessment should compare normalized flow data over time, not a single day's raw reading, before concluding a real decline is occurring.
Increased Differential Pressure
Differential pressure (the pressure drop between the feed inlet and the concentrate outlet of the membrane array) rises as fouling or scaling accumulates and physically restricts flow through the system. A rising differential pressure trend, particularly one concentrated at the lead elements of the array, is one of the most direct mechanical indicators available and should be tracked continuously rather than checked only when a problem is already suspected.
Higher Conductivity
Rising permeate conductivity indicates declining salt rejection, which can result from membrane degradation, a developing seal or O-ring leak allowing feed water to bypass the membrane, or physical membrane damage. Because conductivity is quick and inexpensive to measure continuously, it is one of the most cost-effective early warning parameters available, and a gradual upward trend (even while still technically within acceptable limits) is worth investigating rather than dismissing as normal variation.
Poor Salt Rejection
Salt rejection percentage, calculated from feed and permeate conductivity, provides a normalized view of membrane performance that is easier to compare over time than raw conductivity alone. A declining rejection percentage trend across multiple readings, rather than a single anomalous data point, is the more reliable signal: a single high reading can result from a temporary sampling or calibration issue, while a sustained trend usually reflects an actual change in membrane condition.
Increased Operating Pressure
If feed pressure has to be increased to maintain the same permeate flow, this indicates growing resistance to flow through the membrane, most commonly from fouling or scaling. This is a self-reinforcing problem if left unaddressed: operating at higher pressure to compensate for fouling can itself accelerate further fouling and increase the mechanical stress on membrane elements, seals, and the high-pressure pump, making early correction more valuable than simply pushing pressure higher to compensate.
Membrane Fouling
Fouling from particulates, organics, or biological growth typically shows up as a combination of rising differential pressure and declining flow, often concentrated at the lead elements of the array where feed water first contacts the membrane surface. Confirming fouling as the specific cause, rather than assuming it, usually requires reviewing feed water SDI trends and pretreatment performance data alongside the membrane's own operating parameters.
Membrane Scaling
Scaling tends to present differently from particulate fouling (typically a more gradual, system-wide decline in rejection rather than a sharp, localized pressure spike) and is more common in systems where antiscalant dosing has not kept pace with a change in feed water hardness or a recovery rate increase. Distinguishing scaling from fouling matters because the corrective actions differ significantly.
Biofouling
Biofouling can present with a distinctive pattern: an initial period of gradually worsening performance that then accelerates once biofilm becomes well established, sometimes accompanied by a detectable odor in reject water or unusual pressure behavior that doesn't fully match a typical scaling or particulate fouling signature. Because biofilm shelters itself from surface disinfection once established, biofouling that has progressed significantly often requires a dedicated biofilm-dispersing cleaning step rather than standard cleaning alone.
Frequent CIP Cleaning
An RO system that requires CIP cleaning far more often than its original design or historical baseline is signaling that something upstream has changed: pretreatment performance degrading, a feed water source shift, or an antiscalant program that no longer matches current conditions. Treating increasingly frequent cleaning as simply "how this system is now" rather than investigating the root cause typically leads to accelerating membrane degradation over time.
Reduced Recovery Rate
A declining recovery rate at the same feed flow and pressure setpoints often indicates the system is being operated more conservatively in response to fouling or scaling concerns, whether through a deliberate operator adjustment or an automated control response. This is worth investigating directly rather than simply accepting reduced output, since it usually reflects an underlying condition that, once corrected, would restore both recovery and overall system efficiency.
High Energy Consumption
Because the high-pressure pump is the largest energy consumer in most RO systems, any condition that requires higher feed pressure to maintain output (fouling, scaling, or general membrane degradation) directly increases energy cost per unit of permeate produced. Tracking energy consumption per cubic meter of permeate, alongside pressure and flow data, gives a financial lens on the same underlying performance trend and can help justify the cost of proactive maintenance to plant management.
Visual and Physical Inspection Signs
Not every warning sign shows up in the instrumentation data alone. A visible leak at a pressure vessel end cap, discoloration or an unusual odor in reject water, unexpected vibration or noise from the high-pressure pump, or visible corrosion on piping and fittings are all physical signs worth acting on immediately rather than waiting for the next scheduled data review. These physical signs sometimes precede a measurable change in the operating data, particularly for a developing seal failure that may not affect pressure or flow readings until it has progressed significantly.
A simple walk-around inspection (checking for leaks, listening for unusual pump sounds, and visually assessing reject water clarity and odor) takes only a few minutes and should be part of every shift's routine rather than reserved for a formal monthly inspection. Many of the most costly RO failures this resource center's sister guides describe as "sudden" were, on closer review, preceded by a physical sign that had been noticed but not acted upon.
Root Cause vs. Symptom Treatment
It is possible to respond to every individual sign described in this guide (running a CIP cleaning whenever differential pressure rises, adjusting antiscalant dose whenever conductivity creeps up) without ever addressing why these signs keep recurring. If the same signs return within a shorter interval each time, the underlying pretreatment, dosing, or feed water condition driving them has not actually been resolved, only the symptom has been temporarily masked. Facilities that track the interval between corrective actions, not just the actions themselves, are better positioned to notice when a recurring pattern indicates a root cause that still needs attention.
When to Call a Specialist
Some signs warrant bringing in a water treatment specialist rather than relying solely on internal maintenance staff: a sudden and unexplained change that doesn't match any of the typical fouling, scaling, or biofouling patterns, a first-time biofouling event without an established internal protocol, or a membrane autopsy requirement following a recurring unexplained failure. Attempting to diagnose an unfamiliar failure pattern purely through trial and error can waste time and, in some cases, cause additional membrane damage compared to an early specialist consultation.
Preventive Maintenance
- Track normalized permeate flow, differential pressure, conductivity, and rejection percentage on a fixed schedule.
- Investigate any sustained trend in these parameters rather than waiting for a value to breach a hard alarm limit.
- Verify antiscalant dosing and pretreatment performance whenever a declining trend is identified.
- Schedule CIP cleaning based on data trends rather than after a severe decline has already occurred.
- Track energy consumption per unit of permeate as an additional indicator of developing performance issues.
Corrective Actions
Once a specific sign is identified, the corrective action should match the likely cause rather than defaulting to the same response every time: fouling generally calls for a review of pretreatment and SDI, scaling calls for an antiscalant program review, and biofouling calls for disinfection and biofilm-specific cleaning. Applying a generic CIP cleaning without first identifying the likely mechanism sometimes provides temporary improvement without addressing the underlying cause, leading to a faster recurrence.
A useful practical habit is to record which corrective action was taken alongside the sign that prompted it, and then track whether that same sign returns and how quickly. If a CIP cleaning restores performance for many months at a time, the underlying pretreatment and dosing program is likely sound and the cleaning is simply routine maintenance. If the same sign returns within a much shorter interval each time, that shrinking interval is itself a signal that the corrective action is treating a symptom rather than the actual root cause, and a more thorough review of pretreatment, dosing, or feed water conditions is warranted.
Inspection Checklist
A structured inspection (reviewing normalized trend data, checking cartridge filter differential pressure, verifying antiscalant dosing, and physically inspecting accessible components for leaks or damage) should be performed on a fixed schedule rather than only when a problem is already suspected. Facilities that treat this inspection as routine, rather than reactive, consistently catch developing issues while they are still inexpensive to correct.
Documentation for Trend Analysis
None of the signs described in this guide are meaningful as single data points: they only become useful when compared against a documented history of normal operating conditions for that specific system. Facilities that keep consistent, dated records of feed pressure, differential pressure, flow, conductivity, and rejection percentage can quickly tell whether a current reading represents a genuine new trend or falls within normal historical variation, while facilities without this baseline are left guessing every time a reading looks slightly off. Building this record from day one of operation, rather than starting only once a problem is suspected, is what makes early detection actually practical rather than theoretical.
Conclusion
An RO system that needs maintenance almost always shows measurable signs well before a serious failure occurs: the challenge is treating those signs as actionable data rather than background noise. Facilities that monitor normalized performance trends consistently, and respond to sustained changes rather than waiting for an alarm threshold, consistently avoid the unplanned downtime and premature membrane replacement that catch less attentive operations by surprise.
Call to Action
Carbolabs Corporation's technical team can review your RO system's operating data and help identify whether your system needs maintenance now or can be scheduled proactively. Contact our engineers for a performance review.